
Data without limits
With the market responding turbulently to the current covid-19 pandemic and political climate, being able to actively monitor funds with up-to-date data is vital.
To give truly independent financial advice, you need to be advising on the whole of the market but with over 300,000 financial instruments to choose from, you could find yourself having to analyse large amounts of data. Being able to compare entire universes of investment instruments is always important for a financial adviser, but in times of temperamental markets it could be seen as vital to have it at your fingertips at any given time. FinXL, a plug-in tool from FE Analytics, is the definitive tool for the user who wants access to all the data within FE Analytics directly into a Microsoft Excel workbook – and update the material at the click of a button.
Many financial advisers produce their own customised reports and charts in Excel rather than using third-party software. However, importing large sets of data from FE Analytics into Excel can be time consuming and leave room for errors. Being able to link refreshable data directly into Excel to produce and format your own charts and reports and combine these with your own internal market reporting and research documents eliminates that.
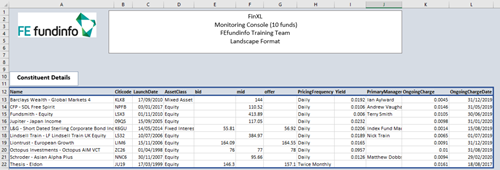
As an example, an adviser might want to produce monitoring workbooks and factsheets that include a breakdown of the different holdings within a portfolio. The funds data can be viewed in Excel and the adviser can now customise it within Excel to suit their own document style.
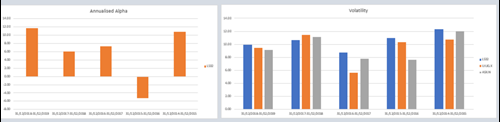
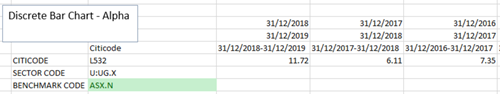
Another way an adviser could benefit from having access to FE Analytics data within Excel, is if they are interested in applying quant screens on funds with a wide range of industry ratios and combining these with visuals in Excel. In the example below we can see how you can use excel formula to quickly change between data references. These references are then used to create powerful share comparison charts.

If you would like to know more about FE Analytics FinXL, join our webinar 23rd October at 2:00 PM or speak to one of our specialists.