
Keep it simple, deliver an outcome - financial plans and successful investment strategies
“People often overestimate what will happen in two years and underestimate what will happen in ten.” Bill Gates, The Road Ahead.
“People often overestimate what will happen in two years and underestimate what will happen in ten.”
Though Bill Gates was talking about the impact of technology in our lives rather than investing, his point about the ability for different timescales to distort how we think about events is relevant. It comes down to human nature and every financial adviser we have spoken to wrestles with human nature and their clients (hopefully figuratively!). Most financial advisers work from a minimum 5-year time horizon, sometimes it is 3.
There is good reason: you know your stuff.
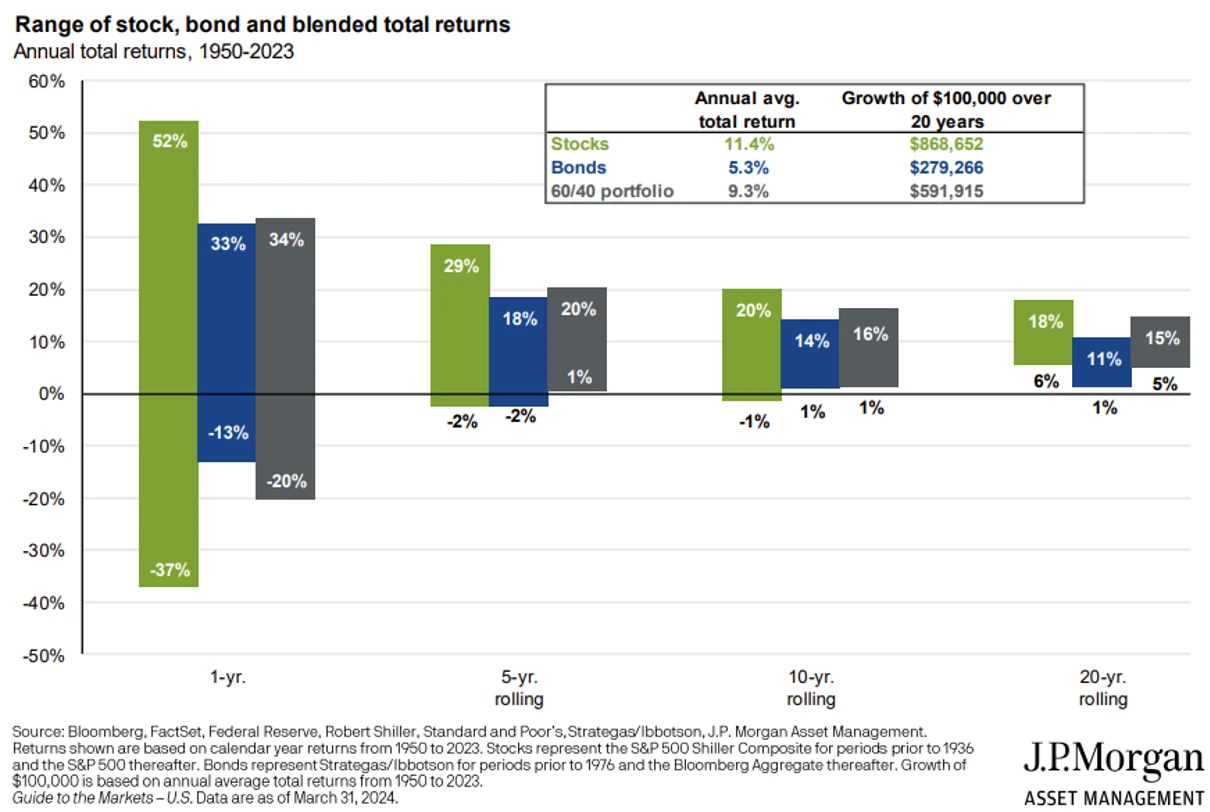
We can see below 73 years of data across bonds and equities, in a 60/40 combination. In the short term there is a large variation of maximum or minimum returns. We know that volatility and risk are defined by large variations in prices which we can see is particularly high over one year.
5, 10 and 20 year rolling data – crossing market cycles – all show that the risk and uncertainty of return diminish over time. So much so that the possibility of larger losses diminish significantly in a time period of over 5 years.
To conclude: time in the market beats timing the market.
What does this have to do with your performance, success and outcomes?
Some financial advisers have explicit time horizons for investment, for others it can be implicit. At FE investments, we have a range of solutions to match either. Hybrid, for example, has an explicit set of time horizons. The aim is to use data, actuarial analysis and our process to maximise the probability of success. Actuaries provide solid market related probabilities.
Our process then aims to qualify identifiable risk and minimise it in the portfolios. We also aim to diversify the noise related risk and sentiment in markets.
The key is to bring risk management and actuarial probabilities together to maximise the chances of success. Markets are inherently risky and volatile – and we all know the phrase past performance is no guide to future returns – so we have to use historical data to help refine portfolios to deliver an outcome.
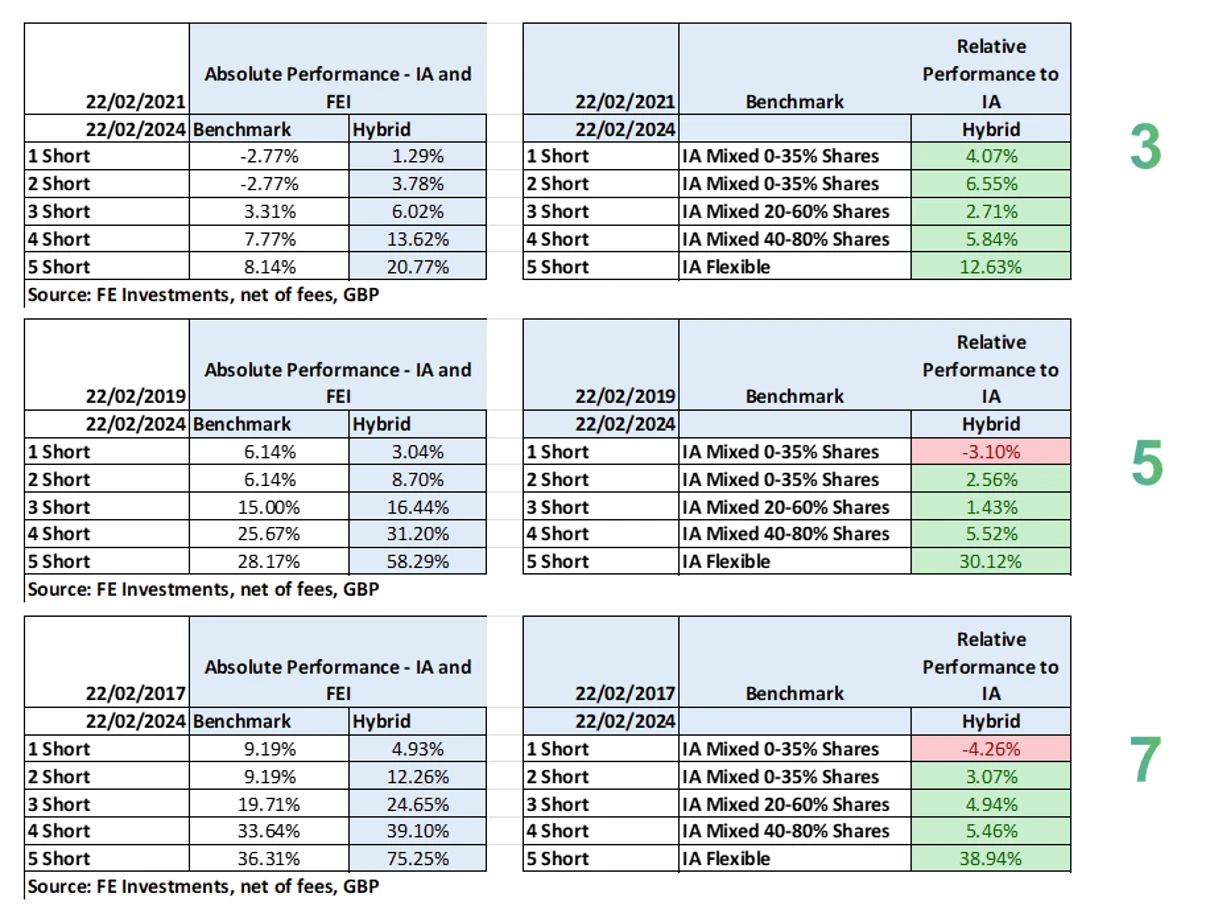
On that basis: how is performance over the time horizons versus the Investment Association (IA) indices, and considering absolute performance?
Key takeaways for FE Investments’ short term portfolios (3-7 years):
- Over 3, 5 and 7 years most portfolios are ahead of the IA
- 1 short term looks to be behind, but it takes 70-80% of the risk of the benchmark, so we would expect it to be behind
- These are mainly lower risk portfolios with an element of capital preservation
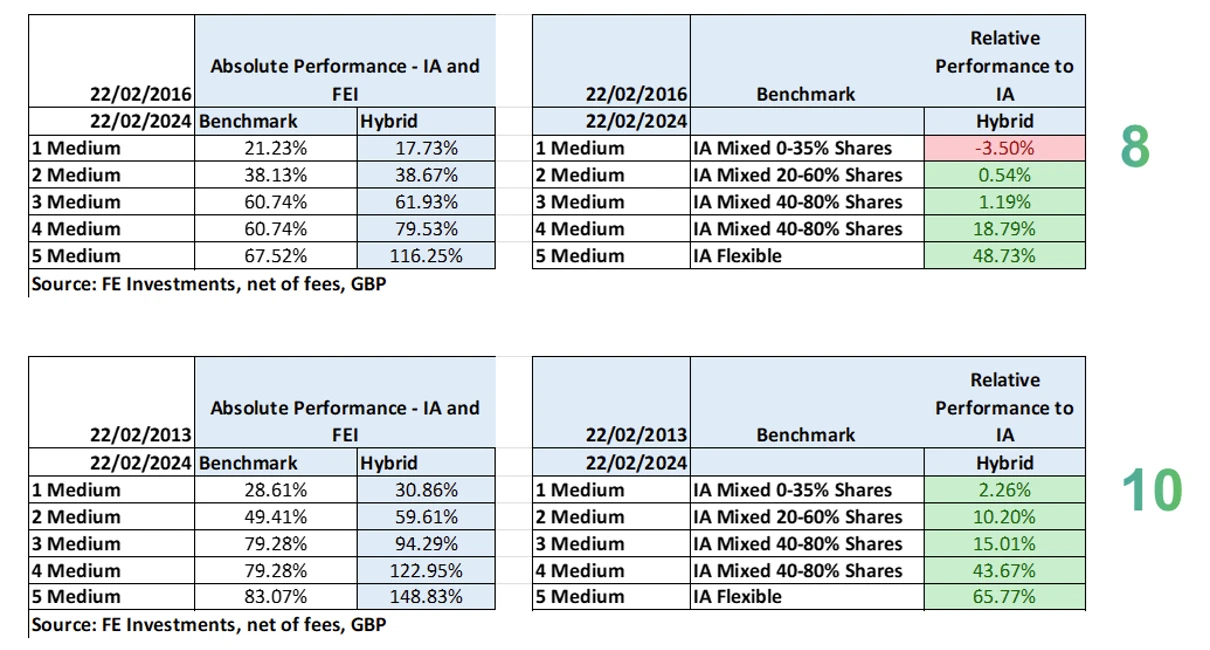
Key takeaways for FE Investments’ medium term portfolios (8-15 years):
- Over 8 and 10 years, performance is good and they are ahead of the IA. They don’t meet their maximum time horizon
- 1 medium is behind after the worst bond market in 50 years – but only by 0.44% per annum with a gain of 17.73%. We think this is marginal
- At 10 years we have passed a good portion of the time horizon and we can see the returns vs the IA are good to great
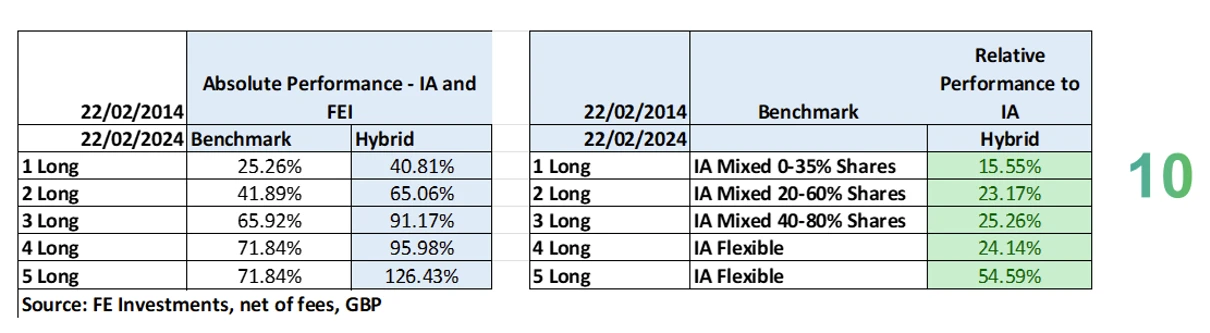
Key take aways for FE Investments’ long term portfolios (16+ years):
- These portfolios don’t meet their maximum time horizon, but 10 years is a good run in
- Performance is strong across all portfolios
- Whilst it is easy to rest on the performance, it would be remiss not to mention that equities have had a great run, whilst bonds have languished
- We could see some reversal in the short term for both asset classes which is the nature of markets
Performance: good, bad, good, bad - and not necessarily in that order
Markets are unpredictable. The Bank of England and EV, our actuary, have done research which indicates that there is mainly noise in markets over 3 years. Longer than three years, interest rate movements, inflation, taxes, etc weigh into asset prices. Why? Probably because investment banks concentrate on up to 3 year forecasts. It may be because of human nature.
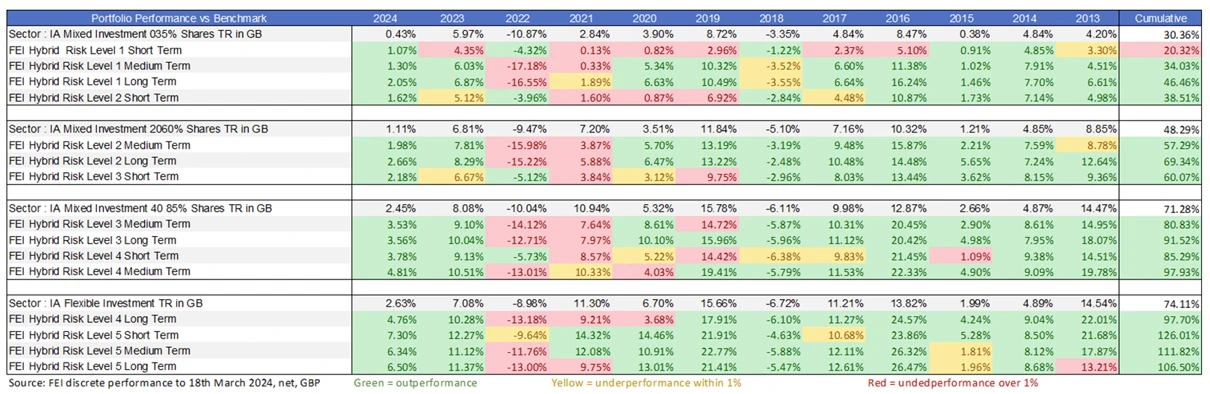
Looking at discrete annual performance we can carve up the performance. Above we can see the cumulative performance is good. Below we can see the journey which leads to the outcome.
Portfolios are collated against their IA index. Good years are in green, marginal years are yellow and in the weak years, the performance is in pink.
Key takeaways:
- As you would expect, there is good and bad. That goes for which ever DFM you use
- As you would expect, the short-term portfolios preserve capital better in tough years
- As you would expect, the cumulative return adds up maximising the probability of success for a strategy, with a given time horizon
What about the short term – sub-3 years?
2023 and 2024 to date have been largely positive – remember – it all adds up and a year and a half is not a strategy, it is (good) noise. Still, you can see that the performance is in line with expectations which acts to counterbalance the weaker years. We cannot predict when those weak years will be or exactly how weak they’ll be (we do estimate it for you in our portfolio reports). What we do know is that we provide a robust foundation which aims to deliver positive client outcomes over the investment time horizon.
The question to you is: should you use 3-year performance as your estimation of a DFMs performance, or should you use the outcome?
After all, isn’t that what financial planning is all about…
How can we help?
Important information:
This is a marketing communication, intended for financial advisers only. Not for use by retail investors. It is not intended as a recommendation to buy or sell any particular asset class, security or strategy. The value of investments and the income from them may go down as well as up and you may not get back the amount originally invested.