
What is the future of the 60/40 portfolio?
In the first two articles of this series we looked at the theory behind the 60/40 portfolio and why that strategy was challenged in 2022. We concluded that investment returns have largely been driven by supply-side inflation which caused the performance of bonds and equities to become more positively interconnected (correlated) in 2022. However, inflationary periods do not last indefinitely. Periods of positive correlation have occurred before, and the "fire and ice framework" (a study of how inflationary (fire) and deflationary (ice) periods have flowed through an economic cycle, created by asset manager Man Group) can help us establish why and how frequently they occur, and therefore help us establish the periods when a 60/40 portfolio structure might be most beneficial.
The framework sets out four market conditions which influence the correlation between bonds and equities. According to the thesis, we must always be in one of four stages of an economic cycle. Although inflation is a key factor, the current stage of the cycle is a more important driver of financial markets; from depression to recovery, from to growth to recession. If we develop an understanding of where we are in an economic cycle then we can make better sense of current events.
The "fire and ice" framework
In 2017, Man Group published a paper titled ‘Fire, Then Ice’. This work was updated this year1 and explores the correlation between bonds and equities over the past 150 years and how they perform under different market conditions. They concluded that there are four scenarios:
- Disinflation – a reduction in the rate of inflation (downward trend in inflation). Positive stock/bond correlation. Equities up, bonds up.
- Inflation (Fire) – high and increasing prices. Positive stock/bond correlation. Equities down, bonds down more.
- Deflation (Ice) – a decline in prices of goods and services (negative inflation). Negative stock/bond correlation. Equities down, bonds up.
- Reflation – increasing rate of inflation. Negative stock/bond correlation. Equities up, bonds down.
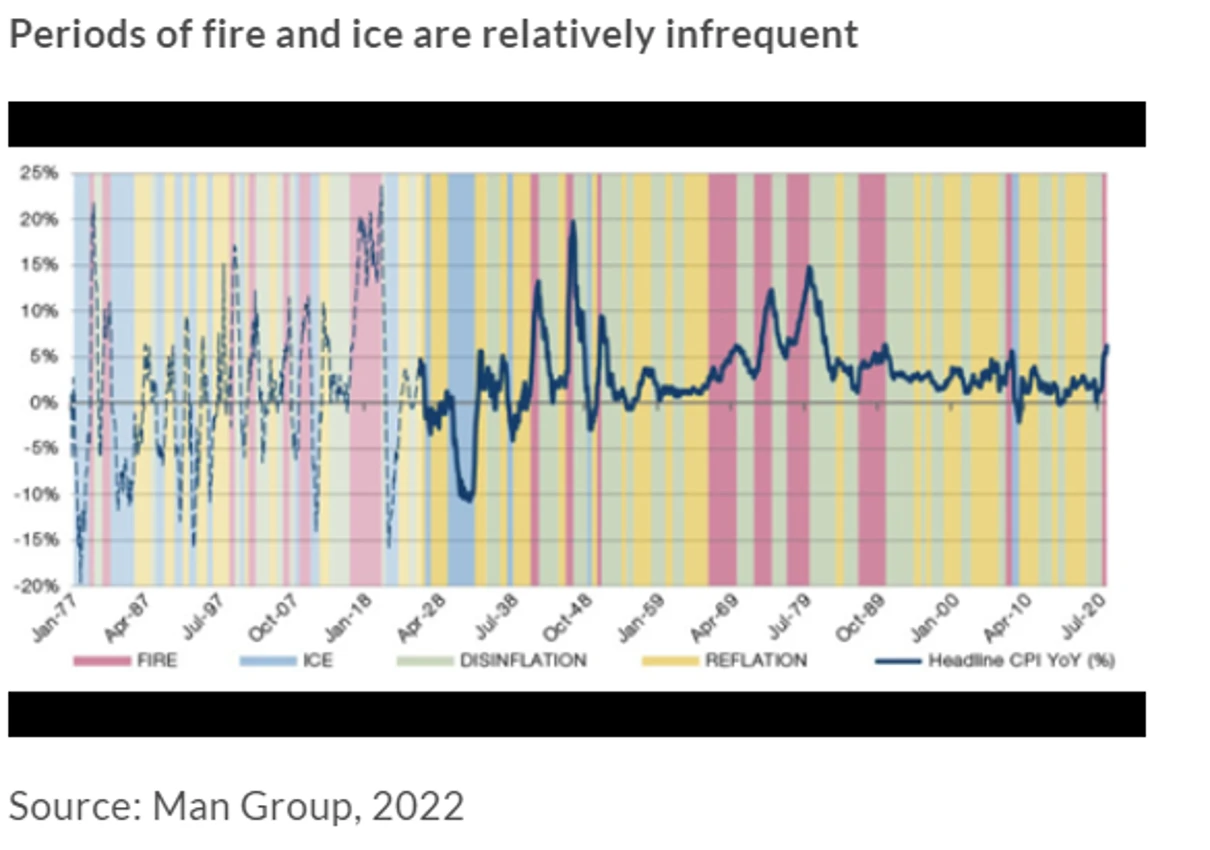
The chart below depicts these stages, as well as detailing the frequency at which they occur. The inflation, or “fire”, we are currently experiencing has been experienced before, most notably during the 1970s when a sharp and sustained rise in oil prices caused a similar supply shock. The fire regime occurred 18% of the time in the 150 years covered by the research and is part of the economic cycle when the supply-side is under pressure. This is not an insignificant number, but it is a small percentage considering it is the only regime when the 60/40 portfolio typically falls in value, as annualised returns averaged -6% in these periods.
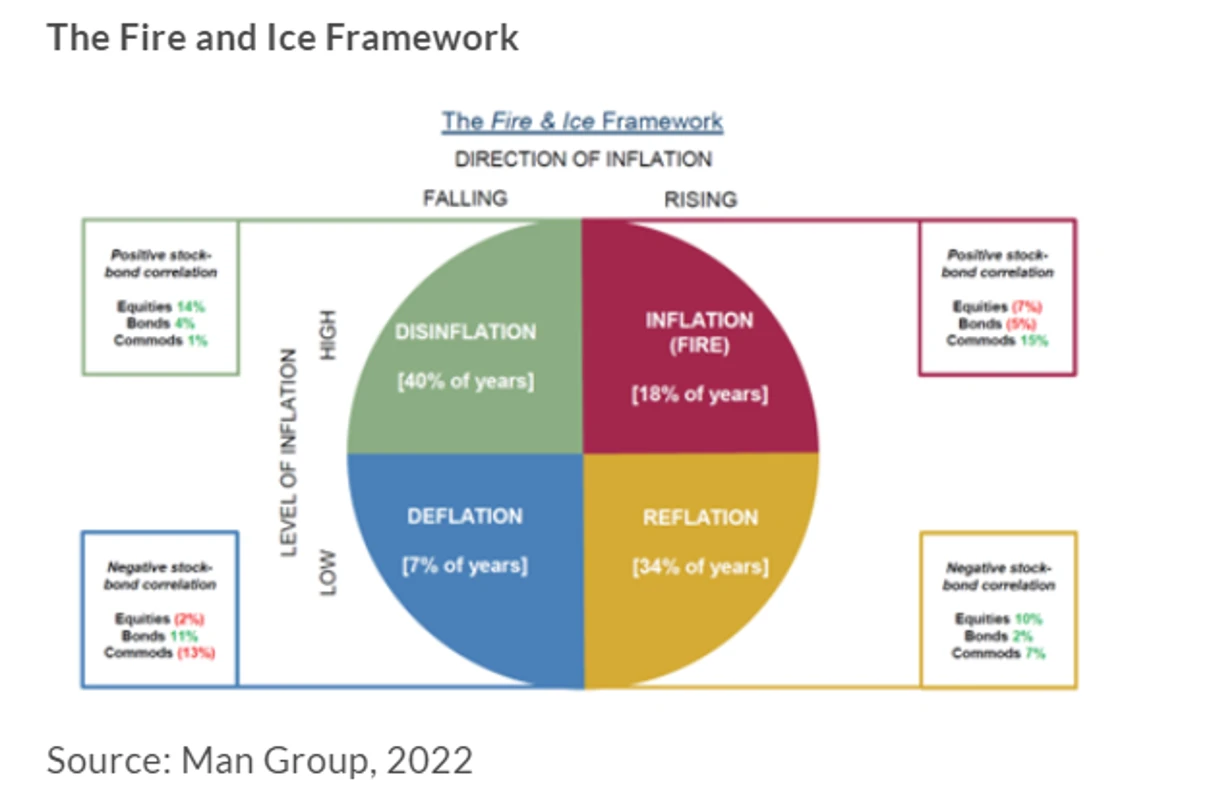
Periods of deflation, or “ice”, with falling inflation and negative growth are infrequent too. We have seen it persist twice since 1929 – after the Wall Street Crash and after the Global Financial Crisis - though it did appear for a brief spell in 1948 in the aftermath of World War II. Whilst infrequent, deflationary or ice environments have typically followed systemic events in markets. The war between Russia and Ukraine is ongoing and the outcome uncertain but there are circumstances where deflation could prevail. Hypothetically if the war finished and energy prices fell very sharply, a period of falling prices could occur.
What appears more likely are prolonged disinflationary periods which we saw after the fire scenarios in the 1970s. Bonds react well to these periods as markets price out interest rate rises while equities pick up due to the better outlook. Reflation normally follows disinflation as the economy starts growing again, this sees appreciation of bond values slow but equities continue to push higher. Considering these regimes occur 74% of the time, annualised returns of 10% during disinflation and 7% during reflation for the 60/40 portfolio is very positive.
60/40 portfolios can make a comeback
So, is the 60/40 portfolio dead? We do not think so. Recent performance is a result of the temporary economic climate which is driving down prices in many areas of the financial markets, but using this approach remains a valid long-term strategy. There is no perfect investment strategy. For the 60/40 portfolio the most difficult conditions are caused by external, supply-side inflation which deteriorates the outlook for economies and equities alike, while still pushing up interest rate expectation and dragging the value of bonds.
Investing is about playing the percentages and they favour a portfolio that includes both bonds and equities. To draw a good return, an investor must take on risk, which means negative periods may occur. We have seen that the 60/40 portfolio faces headwinds when navigating through periods of fire, but, with this occurring in just 18% of years, we believe the combination of equities and bonds will pay off over time.


How can we help you?
Sources
1. Varying by degrees: Fire and Ice 2.0. Man Institute, January 2022
Important Information:
This is not a financial promotion and is not intended as a recommendation to buy or sell any particular asset class, security or strategy. All information is correct as at the date of publication unless otherwise stated. Where individuals or FE Investments Ltd have expressed opinions, they are based on current market conditions, they may differ from those of other investment professionals and are subject to change without notice.
This communication contains information on investments which does not constitute independent research.